
Linux Log Analysis

7 - 13 min read
Sep 21, 2022

With the rise of containers and virtual machines, some system administrators check their system logs less frequently. However, this is a mistake. Even if an application is containerized, it is still important to keep and analyze logs.
For instance, if a sysadmin wanted to find the root cause of a failure or to track down a system attack, they would need to know what happened, when it happened, and what components of their software and hardware stack were affected. They also need to be able to rely on the information that’s stored in the logs.
Without consistent log analysis and management, valuable time can be wasted, time that might not be there during an emergency. When running servers, high observability should be held at all times, whether they are physical, virtual, or containerized. Without the ability to view system logs reliably, understand what they mean, and know how to use them, problems can go unnoticed. Users can gain this observability with knowledge of log files and log file analysis. This article will serve as an introduction to log files, log file analysis, and log file analysis tools and techniques for both novice and advanced users. By the end of the article, users can expect to have a better understanding of log files, and tools to get started with log analysis.
What Is a Log File?
A log file is a computer-generated data file that contains information about usage patterns, activities, and operations within an operating system, application, server, or device. A log file is always the primary data source for network observability. Multiple log files represent a historical record of everything and anything that happens within a system, showing events that can reveal whether resources are performing correctly or running with flaws. These events can be transactions, errors, and intrusions. The data transmitted from log files can be sent in structured, semi-structured, and unstructured formats.
Where Do Log Files Come From?
Log files are automatically computer-generated whenever an event with a specific classification takes place on a network. These events could involve apps, containers, databases, firewalls, endpoints, IoT devices, servers, web services, other networks, etc. Much of the infrastructure that we use daily produces log files.
Log File Examples for the Linux Operating System
Each operating system has a log management system that centralizes all log files to gather, sort, and analyze log data. Linux event logs are placed into four categories: application logs, event logs, service logs, and system logs. Application logs are created to track the behavior of many different applications. These logs contain records of events, errors, warnings, and other messages that come from applications. Event logs provide an audit trail, enabling system administrators to understand how the operating system behaves and diagnose specific problems. These logs record events that take place during the execution of a system. Service logs track critical background services with no graphical output, which is important for services that run without a user interface. System logs contain events logged by operating system components, such as device changes. A familiar log for many, system logs can help users discover errors within their systems, such as non-kernel boot errors and application errors.
Who Uses Log Files?
Many professionals within the technology sector utilize log files in their daily work for valuable insights. For instance, information technology operation teams use log files to identify infrastructure balance, manage workloads, reduce cost and risk, maintain uptime, and ensure business continuity. Another example is developer operation teams using log files to detect critical application errors and identify areas to optimize application performance. Even code developers use application logs to help them understand and measure how applications behave during development and before release. These examples show how critical knowledge of log file analysis tools and techniques is within the industry.
What Is Log File Analysis?
L og analysis is the process of reviewing, interpreting, and understanding logs from web servers to measure the crawl behavior of search engines and determine potential issues or use-case opportunities. The basic five-step process for managing logs with log analysis software are instrument and collect, centralize and index, search and analyze, monitor and alert, and report and dashboard. The instrument and collect step involves installing a collector to collect data from any part of a user’s stack. Log files can be streamed to a log collector through an active network, or they may be stored in files for later review. The centralize and index step involves integrating data from all log sources into a centralized platform to streamline the search and analysis process. Indexing makes logs searchable. The search and analysis step uses pattern recognition, normalization, tagging, and correlation. These techniques can be done manually or using native machine learning software. The monitor and alert measure is done using machine learning and analytics, technologies that help users implement real-time, automated log monitoring that generates alerts when certain conditions are met. The monitor and alert step, and the final step, report and dashboard, can be completed using a good log analysis software capable of streamlined reports and dashboarding.
Getting Started with Log Analysis
Before downloading log management and analysis software, novice users should familiarize themselves with log analysis through the command line. Here, we will be referencing Linux commands for finding and understanding different kinds of logs. Users can find all the logs of a Linux system by running the following command on the terminal:
ls /var/log
Doing so will reveal file names such as syslog, messages, auth.log, secure, cron, kern.log, etc. The syslog or messages file contains general information that logs activities across the system. File names such as auth.log or secure specifically store authentication logs. Cron (a clock daemon) stores cron job-related messages, such as cron initiations and failures. The file name kern is for used kernel logs and related warning messages. User applications such as Apache2 and MySQL can also store their logs in this directory.
What Do Log File Entries Look Like?
By default, log file entries are in a format close to this:
Timestamp, Hostname, Application name, Priority, Message
Hostname refers to the server's name in the system where the message originated. Application name refers to the name of the application that generated the event, and Priority denotes how urgent or severe an event is. Here is an example of a log entry for a failed log attempt with the username root:
May 11 20:04:33 main_server sshd[41458] Failed password for root from 192.168.0.3 port 22 ssh
Linux Command Line Tools for Log Analysis
There are a lot of advanced log analysis tools available, but we’ll focus on command-line tools first. The most common Linux utilities to analyze Linux logs are grep, awk, sed, tail, cut, and wc.
grep
Grep is a search tool for searching inside documents based on plain text or regular expression patterns. Searching for regular expressions for log analysis can reduce false positives and provide a more accurate search. For example, this command searches for lines in the log file that contains IP addresses within the 192.168.25.0/24 subnet:
grep -E "192\.168\.0\.\d{1,3}" /var/log/syslog
Here the -E option is used to specify a regular expression pattern to search for. Users can also utilize the inverse search to rule out certain lines. This command searches for all lines that do not contain IP addresses within the 192.168.25.0/24 subnet:
grep -v -E "192\.168\.0\.\d{1,3}" /var/log/syslog
These expressions are helpful in use-cases such as scenarios where users look for the timestamps, IP addresses, and hostnames of logs that indicate suspicious behavior.
awk
Awk is a powerful text-processing language wrapped into a command-line utility tool. It can filter and parse log files efficiently, making it a powerful utility with many different options. Suppose that this is the format of a log file, for instance, and you want to extract all the usernames that have had a failed password attempt:
May 11 20:04:33 main_server sshd[41458] Failed password for root from 192.168.0.3 port 22 ssh
To extract the username, users can run this command:
awk "/.*Failed password.*/ { print $8 }" /var/log/auth.log
This command would print out the username root. The line “/.*Failed password.*/ finds the lines that contain the string “Failed password, and “{ print $8 } tells awk to print out the eight field of the line. These expressions are helpful in use cases where there are many failed passwords from a single username, an indicator of a brute force attack.
sed
Short for stream editor, sed can read an input file and modify the input as specified by a list of commands. Here’s an example of how to use sed:
sed "s/May 11//g" /var/log/auth.log > newfile.txt
For contextual purposes, the ‘s’ symbol in sed stands for search while the ‘g’ symbol stands for copy and append. The command above will search for lines that contain the string ‘May 11’ and appends all of the contents of those lines found into a new file called newfile.txt. A great use case for this command is if a user needs to see logs from that day precisely.
tail
Users should use the tail command to see the tail end or last couple of file lines:
tail /var/log/auth.log
The default behavior of this command is to output the last ten lines of a file to standard output. However, using tail with the -f flag instructs tail not to stop at the end of the file and to wait for additional data to be appended to the input.
tail -f /var/log/auth.log
A use-case for the command above will be checking if a server is running correctly by looking through the tail of its auth.log file. The user should include ‘-f’ for this specific scenario to get the most current log information.
cut
A command-line utility that cuts and parses files according to a delimiter, cut is perfect for analyzing delimited log files. This command parses the output of the who command to show the names of the users currently logged into the system:
who | cut -c 1-16
This command utility is a perfect tool to help make files easier to read.
wc
This command-line utility displays the number of lines, words, and bytes contained in each input file. What’s cool about wc is that users can pipe the output of some of the above commands. For example, this command counts the times the IP address 111.14.39.220 was logged:
grep -E "192\.168\.0\.3" /var/log/syslog | wc -l
This can be useful for understanding where log-ins are coming from on a server.
Searching with Log Management Systems
One big problem with command-line tools is that they don’t scale well to large files or across multiple systems. A fix is for users to start searching with log management systems. An advantage of using log management systems is that they can simplify analyzing and searching extensive collections of log files. For instance, they can automatically parse standard log formats like syslog events, SSH logs, and web server logs. They can also index each field so that users can quickly search through large volumes of data. Another advantage over command-line tools – grep in particular – that some log management tools utilize are query languages such as Apache Lucene, which provide more flexible searches than grep and an easier search syntax than regular expressions. This means less time and effort for users to create parsing logic for each search.
Recommended Open Source Log Monitoring and Management Tools for Linux
Graylog
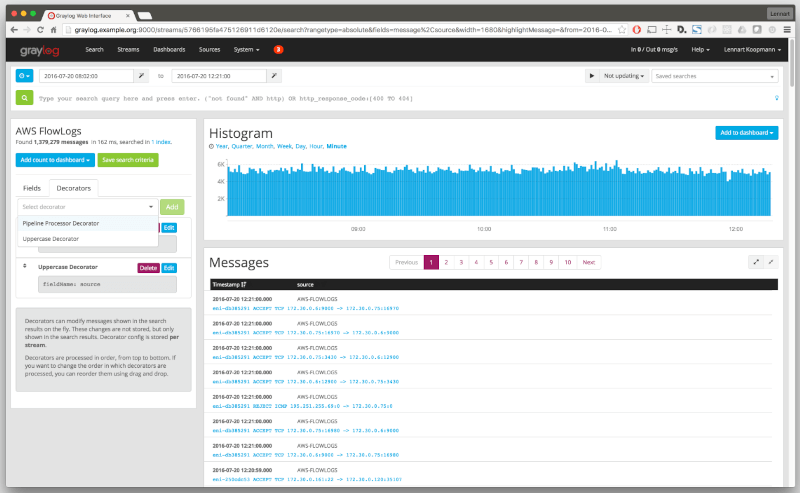
With the integration of the Elasticsearch analytics engine and MongoDB, Graylog can be used to help users quickly collect data from multiple devices such as routers and wireless access points. The user interface – called WebUI – is user-friendly and offers many different functionalities, such as the ability to alert users when a certain condition is met, or an issue has occurred.
Logcheck
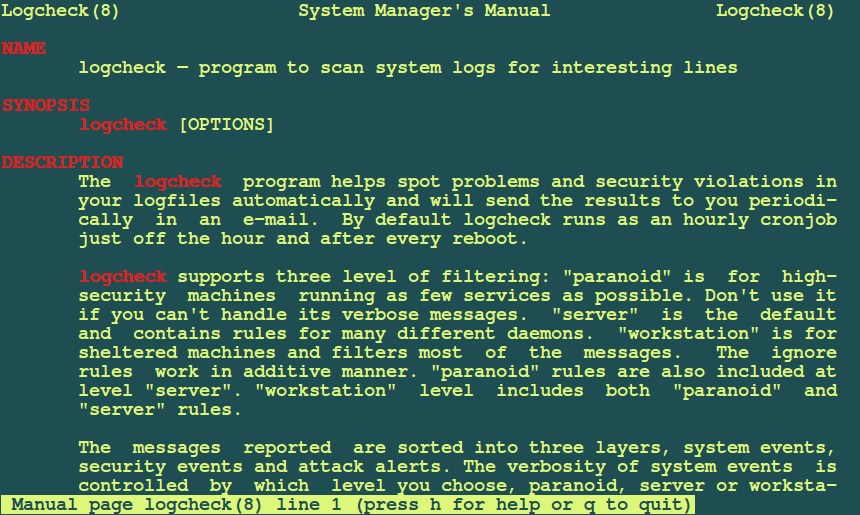
Another open-source log management tool is Logcheck. Able to search through large amounts of log files, Logcheck can detect triggered violations or system events. It can then send a detailed summary of the alerts to a configured email address. This is important for operations teams as the summary can alert them to an issue such as system faults or unauthorized breaches. Logcheck is also capable of sorting messages to be reported into three possible layers, which include security events, system events, and system attack alerts.
Logwatch
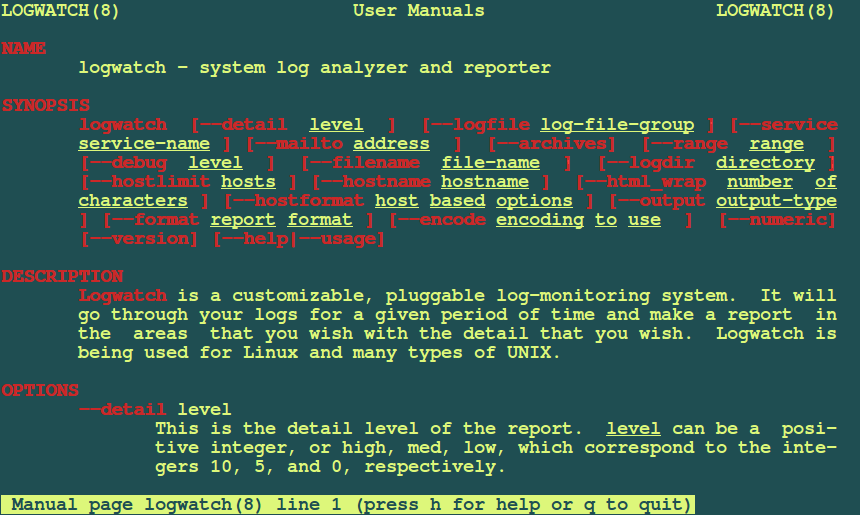
An open-source and highly customizable log collection and analysis application, Logwatch can parse system and application logs and generate reports on how applications run. Users unable to work alongside a proprietary log management tool can rest assured that Logwatch will have all events logged and notifications delivered in the case of any errors or other discrepancies.
Logstash
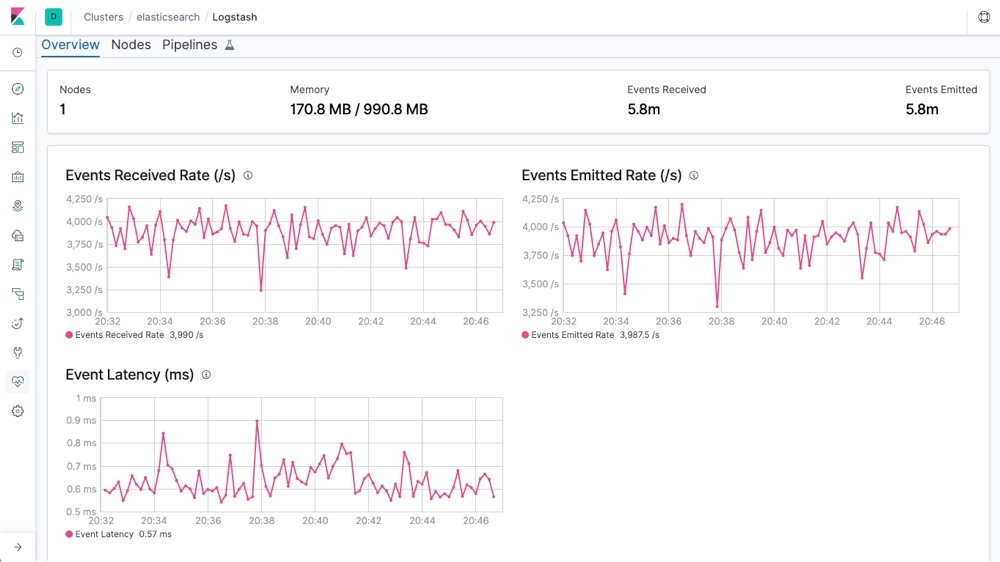
An open-source server-side data processing pipeline, Logstash accepts data from many different sources, including local files or distributed systems such as S3. Logstash then processes the logs and funnels them to search and analytics engines such as Elasticsearch, where they are analyzed and archived. A powerful tool, it can ingest large amounts of logs from multiple applications and output them into different databases or engines simultaneously. In addition, Logstash has an extensive list of data sources that can be piped, including SNMP, heartbeats, syslog, Kafka, etc. For use cases where DevOps professionals are concerned about the observability of their cloud server operations, Logstash is available to provide them a platform to gain that observability.
Closing Thoughts
Understanding how log files work is an essential first step for any user interested in discovering what happens behind their operating systems. Additionally, learning more about log analysis and tools will expand users' knowledge and help them for technology roles in administration and development. Good log analysis means bug-free development environments and faster deployments. For cybersecurity and information technology professionals, practical log analysis means malicious activity not going unnoticed. The importance of log analysis across technology sectors speaks to the extent of learning log analysis as an aspiring technology professional or a professional looking to expand their knowledge; users like you! We hope that this article brings our readers further insight into log analysis.


